The Economic Relationships in Real Estate
Market Insight 2020 in review – the truths, not the drama. Buyer motivation, visits with economic realities, and changing behaviours. Comparison to 2019 stripes away the disinformation. Using 7 Mississauga communities, representing the Detached housing market frenzy. Which I must point out, is different than the townhouse and semi-detached market buying in the same areas, which continues into the winter because of the much more affordable price points.
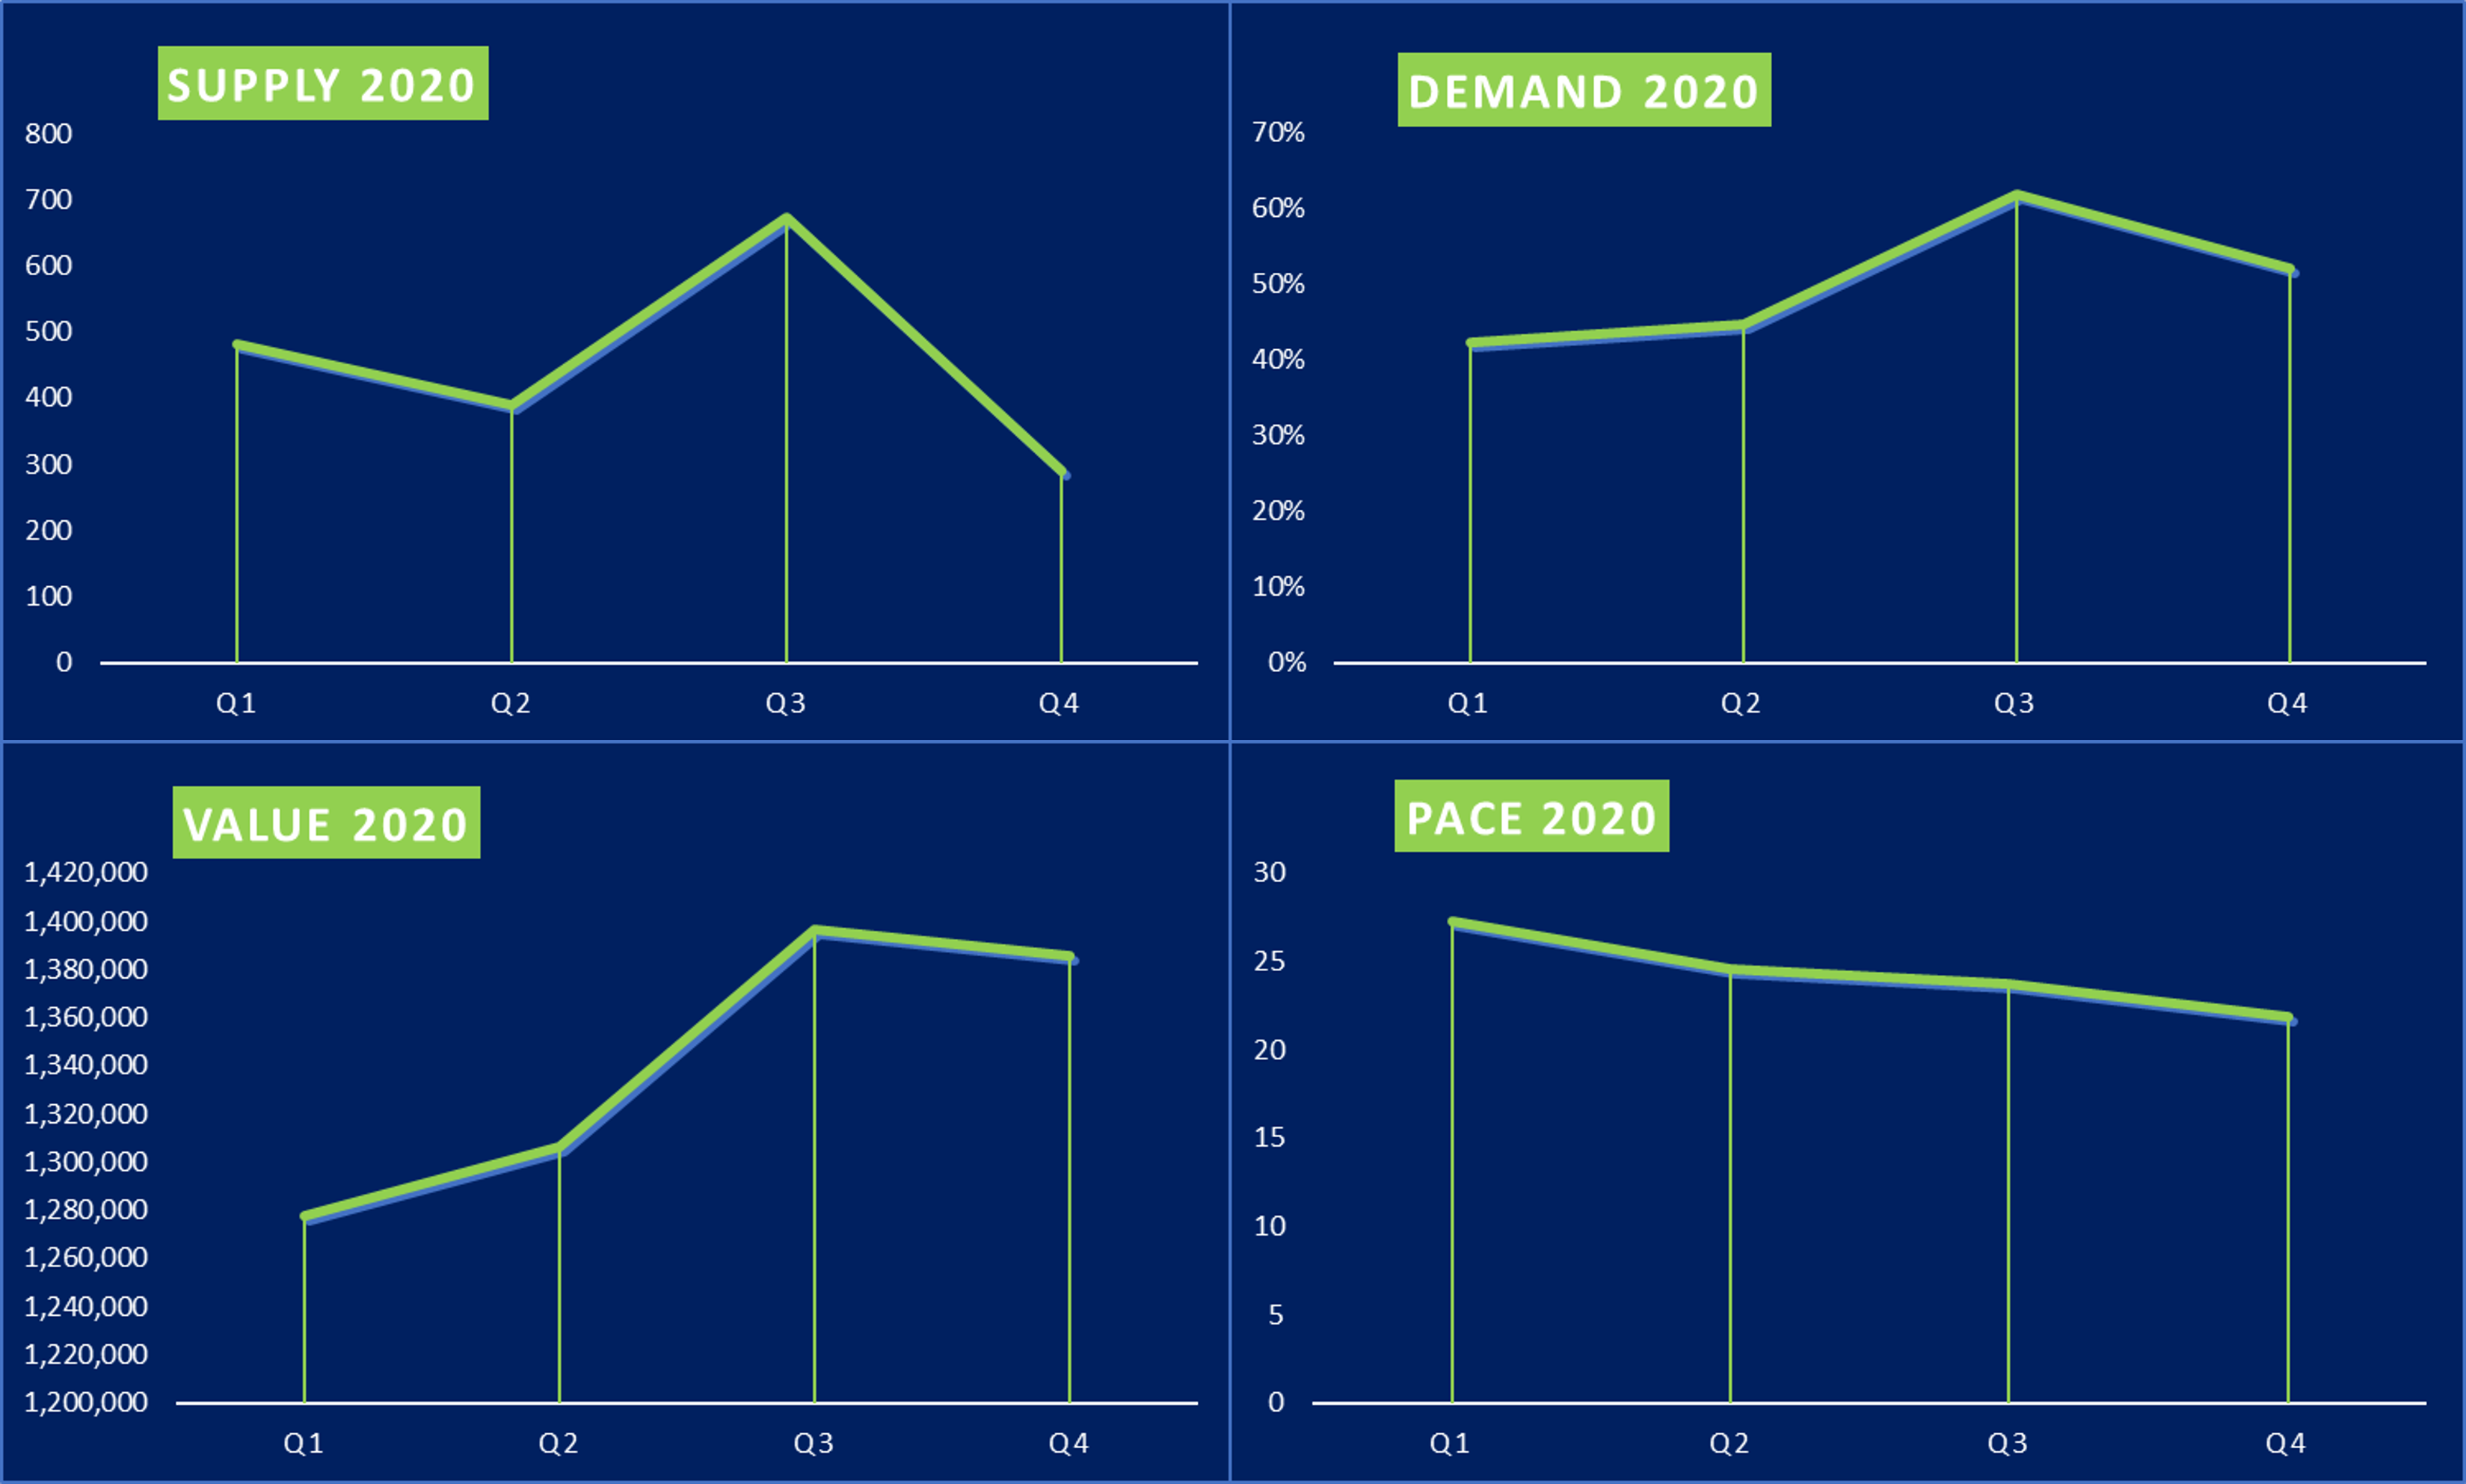
Talk is cheap, so let’s always try to start by interpreting the facts right. The real estate market in 2020, how did it really fair? Generally, very well – it was active, albeit seasonally shifted by 3 months. Basic economic factors of supply and demand had an impact on Value (prices) and Pace (days in market or DOM). The detached, more suburban market was the most in Demand, while the Urban apartment tower-style condominium softened considerably starting with the rental market and moving to the sales market.
Be warned, as just pointed to, different types of housing and location are very influential factors in the Demand part of the equation. There are relationships this year between totally different locations. Those relationships were Pandemic crafted by new-to-us choices and realities. Fear, closure of in-person learning, technology-enabled work from home, financial support from the government, and historically low mortgage rates all contributed to buying and selling choices. This discussion of cause and effect is a relevant framework to explain any of the other Ontario real estate markets. It should help you understand the activity in your area, and be better at filtering the drama and wildly different figures reported in the news.
We took 7 Mississauga communities and analyzed them as a group, focused only on detached properties only in relatively high priced communities, following each of the 4 fiscal quarters. In this analysis, we have results for Clarkson, Lorne Park, Port Credit, Mineola, Lakeview, and Central Erin Mills. Even between these communities, most closely located to each other (and situated in the Lakeshore Corridor), there are other factors that cause results to be different between them.
⇒⇒⇒The level of detail needed to really understand the activity in this market is remarkable. Here are some insights for 2020, and a comparison with the same set of communities for 2019.
Now let’s look at DEMAND, which represents the number of actual sales. As you will see, Demand and Supply work together to create Value and Pace.
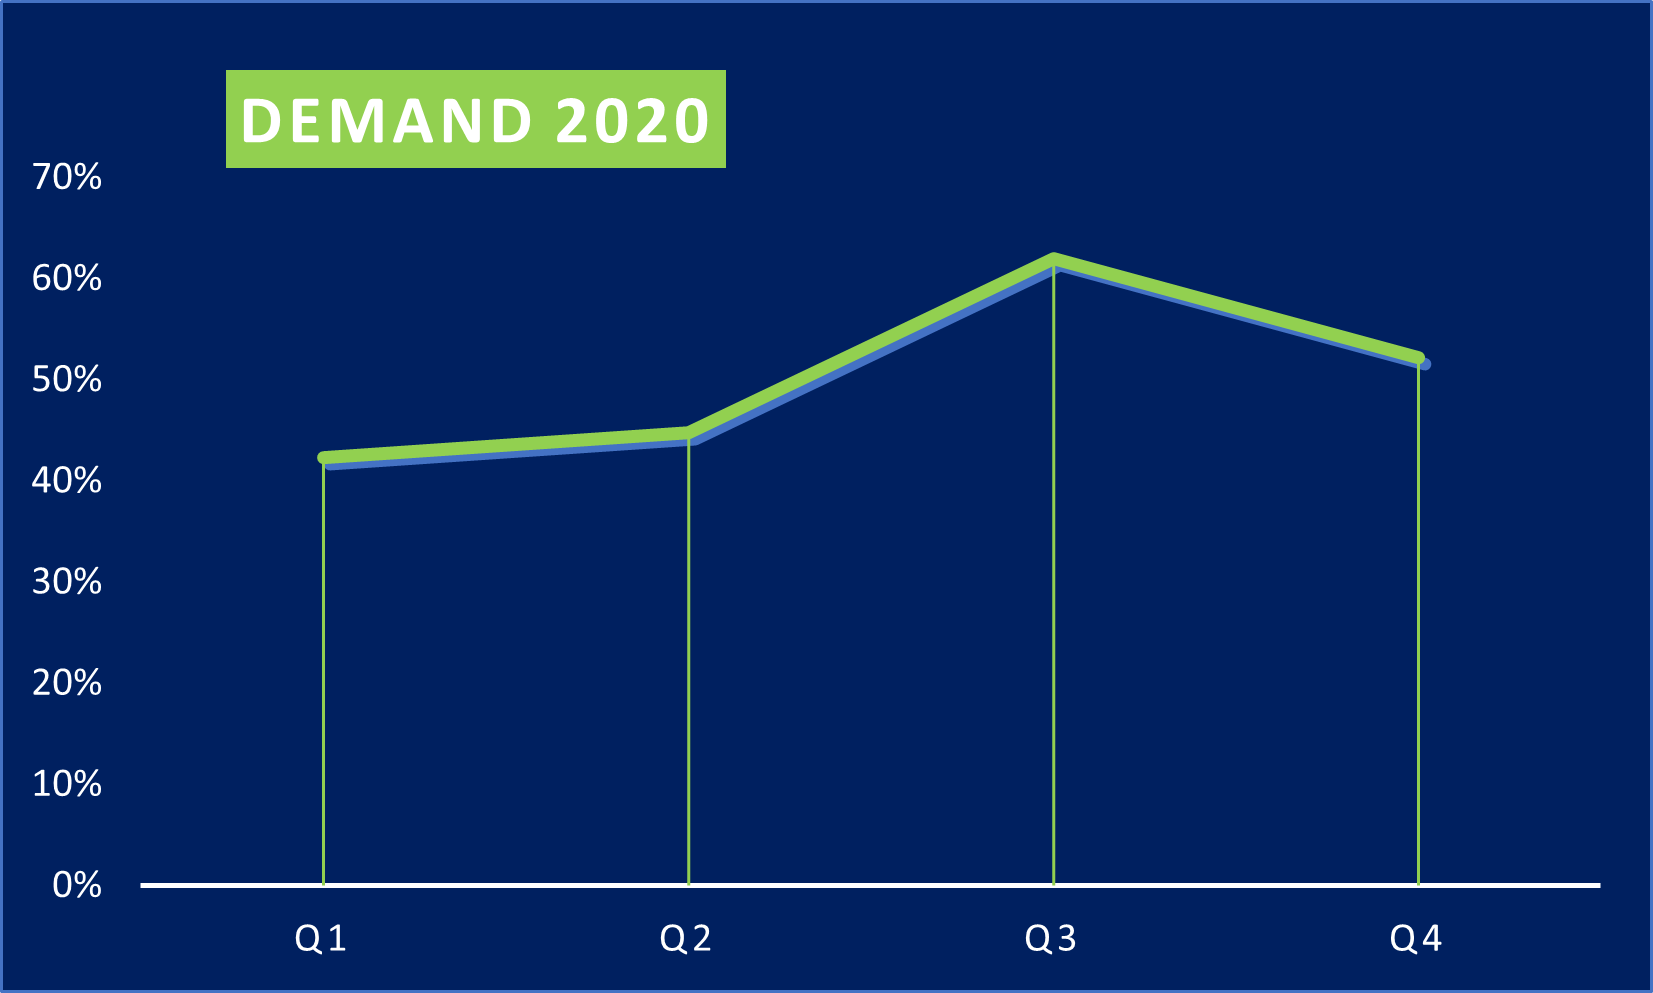
DEMAND – Those Sold (compared to Listed)
DEMAND actually averaged out for the year in 2020, and 2019 was similar. Average Demand in 2020 50%, and 45% in 2019. So on average Demand only increased, on average, by 5% year over year. Yet DEMAND felt both strong and fast-paced. This is because as you see here, demand was more volatile between quarters compared to prior years’ normal seasonality. Also, in 2019 Q1 and Q2 were both weaker demand than the same quarter(s) in 2020. Looking at the two years, 2020 during Q3 hit the peak DEMAND at 62% – meaning 62% of the houses listed (Supply) sold. So over the 3 months of June, July, and August, this level of demand is considered a “Sellers Market”. Effectively, supply is not keeping up very well against sales. The Demand curve of 2020 is actually quite interesting and would represent the shift of normal market heat out further into the year due to the start of the pandemic at the end of March. In 2020, the activity of the normal Spring Market was felt in the Summer instead.
Now let’s look at SUPPLY, which represents the number of houses listed for sale in a given period. There is a direct relationship between Demand and Supply.

SUPPLY – The Number Listed for Sale
SUPPLY in 2020 was less than in prior years (2019 compared) for all four quarters. Although, notably in Q3 Supply was the highest of the whole year; considerably higher. Supply fell off sharply in Q4 in 2020. For Q4, that should mean that PACE and VALUE quicken and rise respectively. But, DEMAND was also falling away quickly and actually outpacing the downward trend in SUPPLY!
Economists predicted this softening activity and prices due to the bigger economic picture caused by the Pandemic (see the previous articles Market Activities Tell the Storey, Bold Decision Time, and Robert Hogue Speaks ). So far the softer Demand and prices in Q4 are as expected if you subscribed to the predictions (which I did). The peak was in Q3 and macroeconomics and common sense tells us that Spring 2021 won’t be the same kind of market we saw this year.
Now let’s look at VALUE – which is the sale prices – and we sure know how this has become the center of the conversation. But remember, “talk is cheap”. So let’s get you ready to talk with more authority.
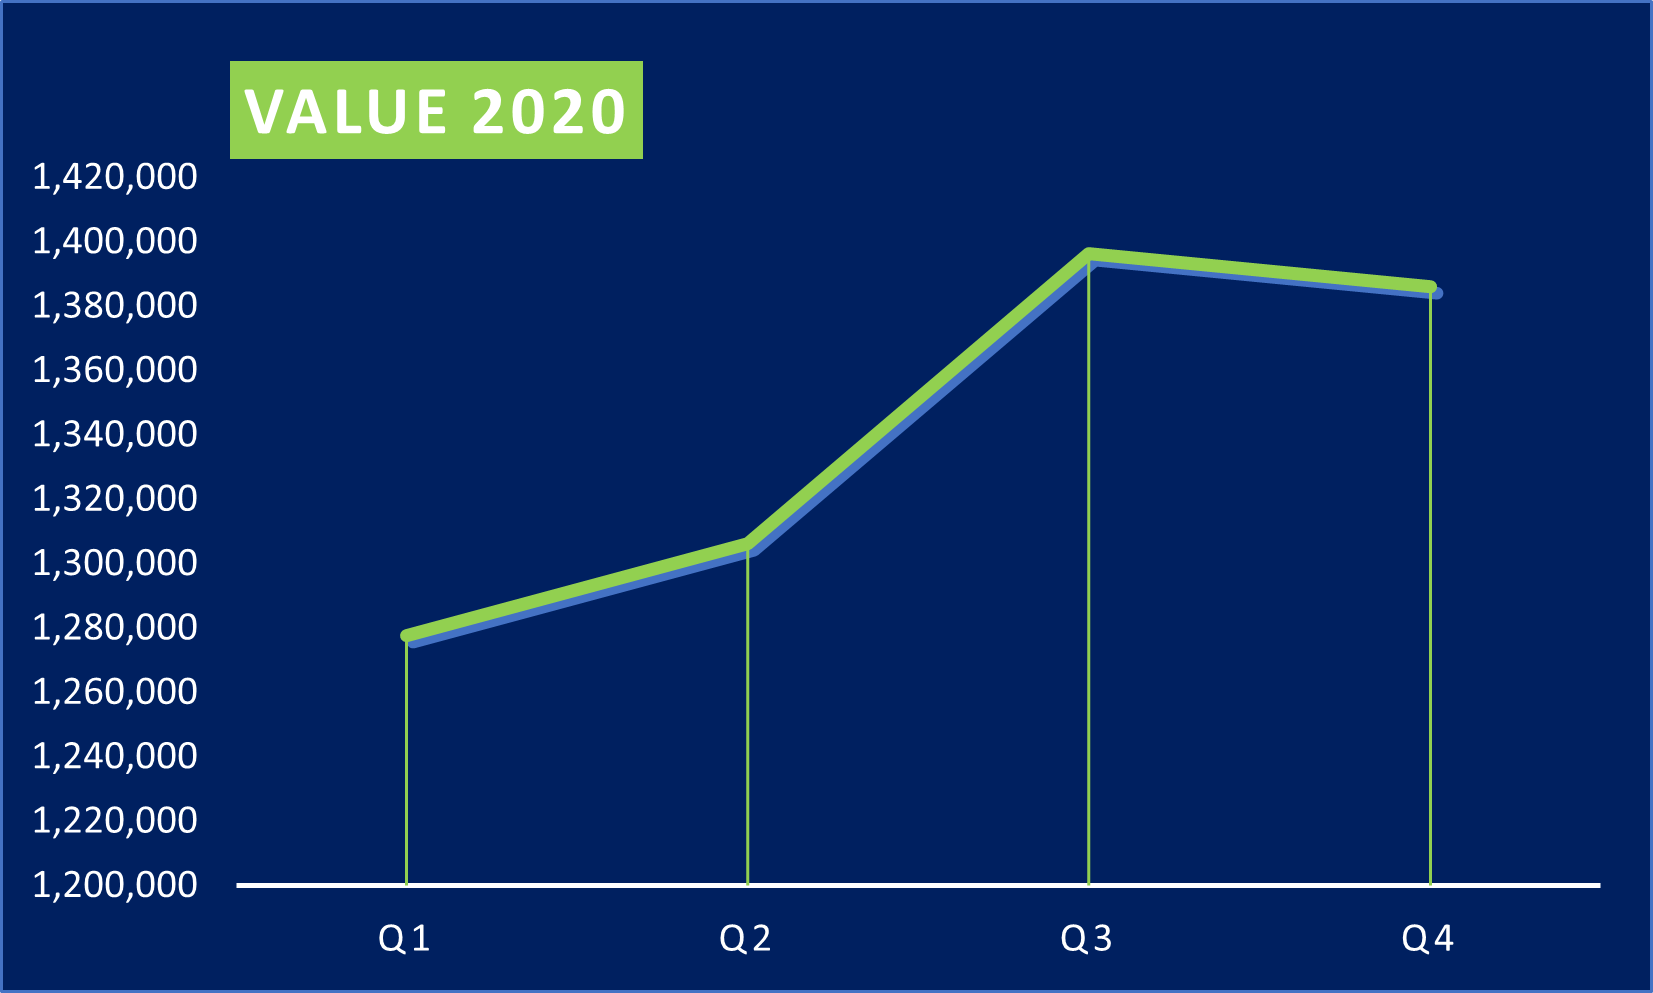
VALUE – The Median Price Paid
VALUE ends up with a direct relationship with DEMAND and SUPPLY. We saw that DEMAND peaked in Q3 during 2020, and SUPPLY also peaked. PACE also quicken a bit. So once again, the volatility between periods is quite evident. VALUE has a pretty direct relationship with SUPPLY in Q3, and really it does so the whole year. So although VALUE softened, it did not tank. But the reality is DEMAND dropped more than SUPPLY by the last quarter of 2020, and that has affected VALUE.
Just before we produce the wind-up comparison chart for 2020/2019, let’s discuss PACE.

PACE – The Average Days in Market (DOM)
PACE (days in the market) ranged from 22 – 27 days over the course of the year. This pace range is reasonable when compared Year Over Year (Y/Y) both around 25 days, yet it felt crazy fast. It was certainly talked about in this way. It interests me to see that although Demand peaked in Q3, PACE barely reflects that (as seen here) and in fact, the PACE curve shows a slow down over the course of the year. The real PACE for any given house was determined by 3 factors:
- Price Point
- Properly Priced Offering (if not properly priced, it is impossible to have a price point that will move in your category). Best case, this is a strategic and skilled analytical choice. Hopes and wishes create what I call false starts. When you are competing, and we are, false starts are very damaging.
- Renovated (contemporary renovations win, hands down, over houses that are not “move-in ready” as defined by today’s Buyers. More on this topic next week’s (Jan 14th) article Solving the Dilemma: Renovated vs Not.
So in reality, there is great disparity hiding within the average days on market. There are two basic human reasons:
- The Buyers are demanding their version of ‘move-in ready”. Renovated properties sold fast, and first.
- Greed and misguided expectations cause Sellers to list at a price too high for the product. This creates the false start I mentioned earlier. Eventually, after far too many days the price is dropped into the right range. So this obviously creates longer days in the market.
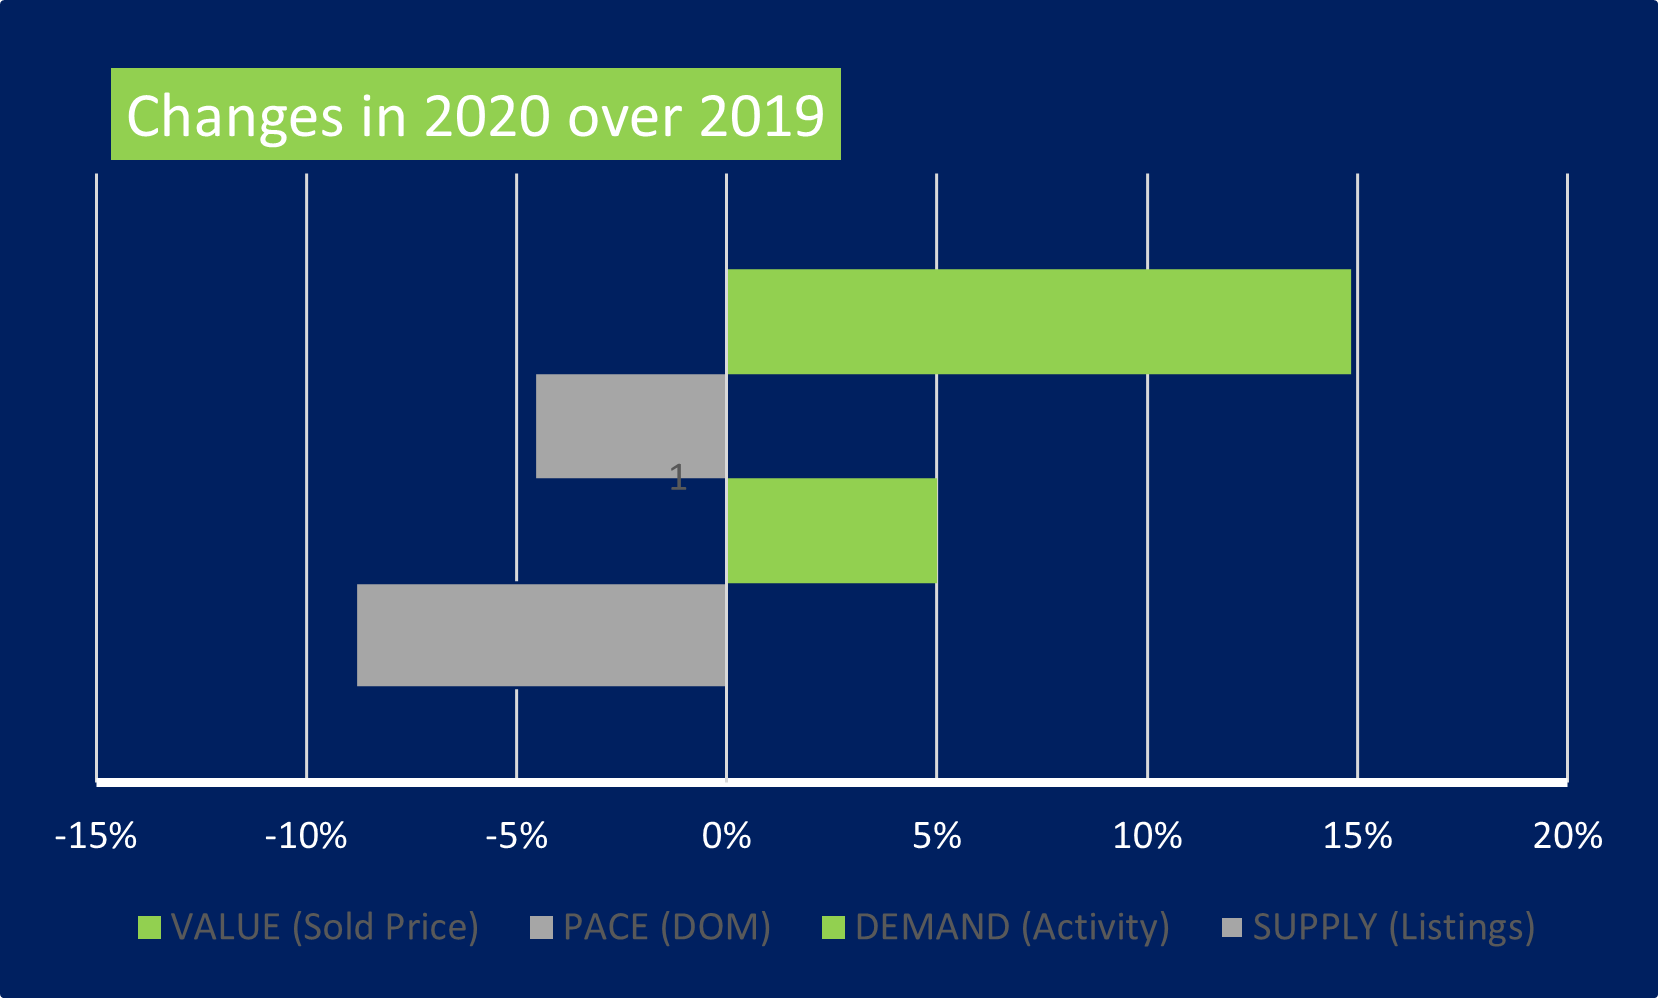
CHANGE SUMMARY – 2020 / 2019
Where the rubber hits the road. For this group of communities, bundled together, DEMAND was up 5%, while SUPPLY was down 9%, and PACE was down 5%, and VALUE up 15%. Oviously, as I commented initially even these relatively homogenous selections for location and type of house have different profiles independently.
Different Pockets (community streets) – Different Behaviours
In the GTA we saw condo apartment rentals and sales heavily hit – activity and prices down. Detached houses in the GTA and perimeter plus Cottage Country went up considerably in activity and price. Why?
Condo Market – Toronto
- Temporary residents left town or the country due to closures and constraints caused by the Pandemic.
- Historically low mortgage rates made a purchase over rental a good decision.
- Work from home forced an appetite for larger space.
Cottage Sales
- Working from Home requirements made leaving town possible.
- Relatively remote communities offered the chance to enjoy a lifestyle while staying safe during the pandemic.
Shrink in Supply
- Senior owners in detached homes declined to move during the Pandemic.
-
If you have questions about your particular situation or your community, please don’t hesitate to reach out.