We are challenged to see the reality of the real estate market at any given moment. There are many segments – for example, commercial and all those variations, and residential with all its variations of type, age, and general location. So even when looking specifically at residential real estate, it’s tough to see the “forest for the trees”. There are geographic pockets and those produce vastly different levels of activity and trend outcomes. And let’s not forget the media quoting anything that has a dramatic flair, and all our neighbours quoting the news to the best of their ability.
However, it’s fair to say that the “late Spring Market” which traveled into August was quite hot and activity levels (listings, showings, offers, and sales) showed large positive changes year over year. This makes sense remember because they measure the same month in the two years. So given the whole Spring Market period shifted by about 5 months no wonder we see those dramatic statistics.
Now we have fully entered the Fall Market, and we are showing the TRREB Statistics for September here, and August because we seem to be on-trend. In between, I have a piece that preempted September that shows the activity pattern diverging which would be consistent with the slow down I predicted.
The TRREB Statistics for September suggest the divergence was indeed happening. This was so because the Seasonally Adjusted number of transactions was actually down 5.3%. Because we shifted the activity the pattern was broken. This shows up in the price sold statistics too. While year over year shows a 14% increase, on a seasonally adjusted basis it is actually down (-3.4) in September. Folks, I think the economic shift has happened as expected.
August Statistics showed a seasonally adjusted number of transactions increase year over year at 10.5% (but by September it is -5.3%). Likewise, August Statistics show a seasonally adjusted selling price increase of 2.6% (but by September it is -3.4%). If you have questions about how this might impact your plans, please don’t hesitate to contact me and we can define what it means for you. Each situation is somewhat unique
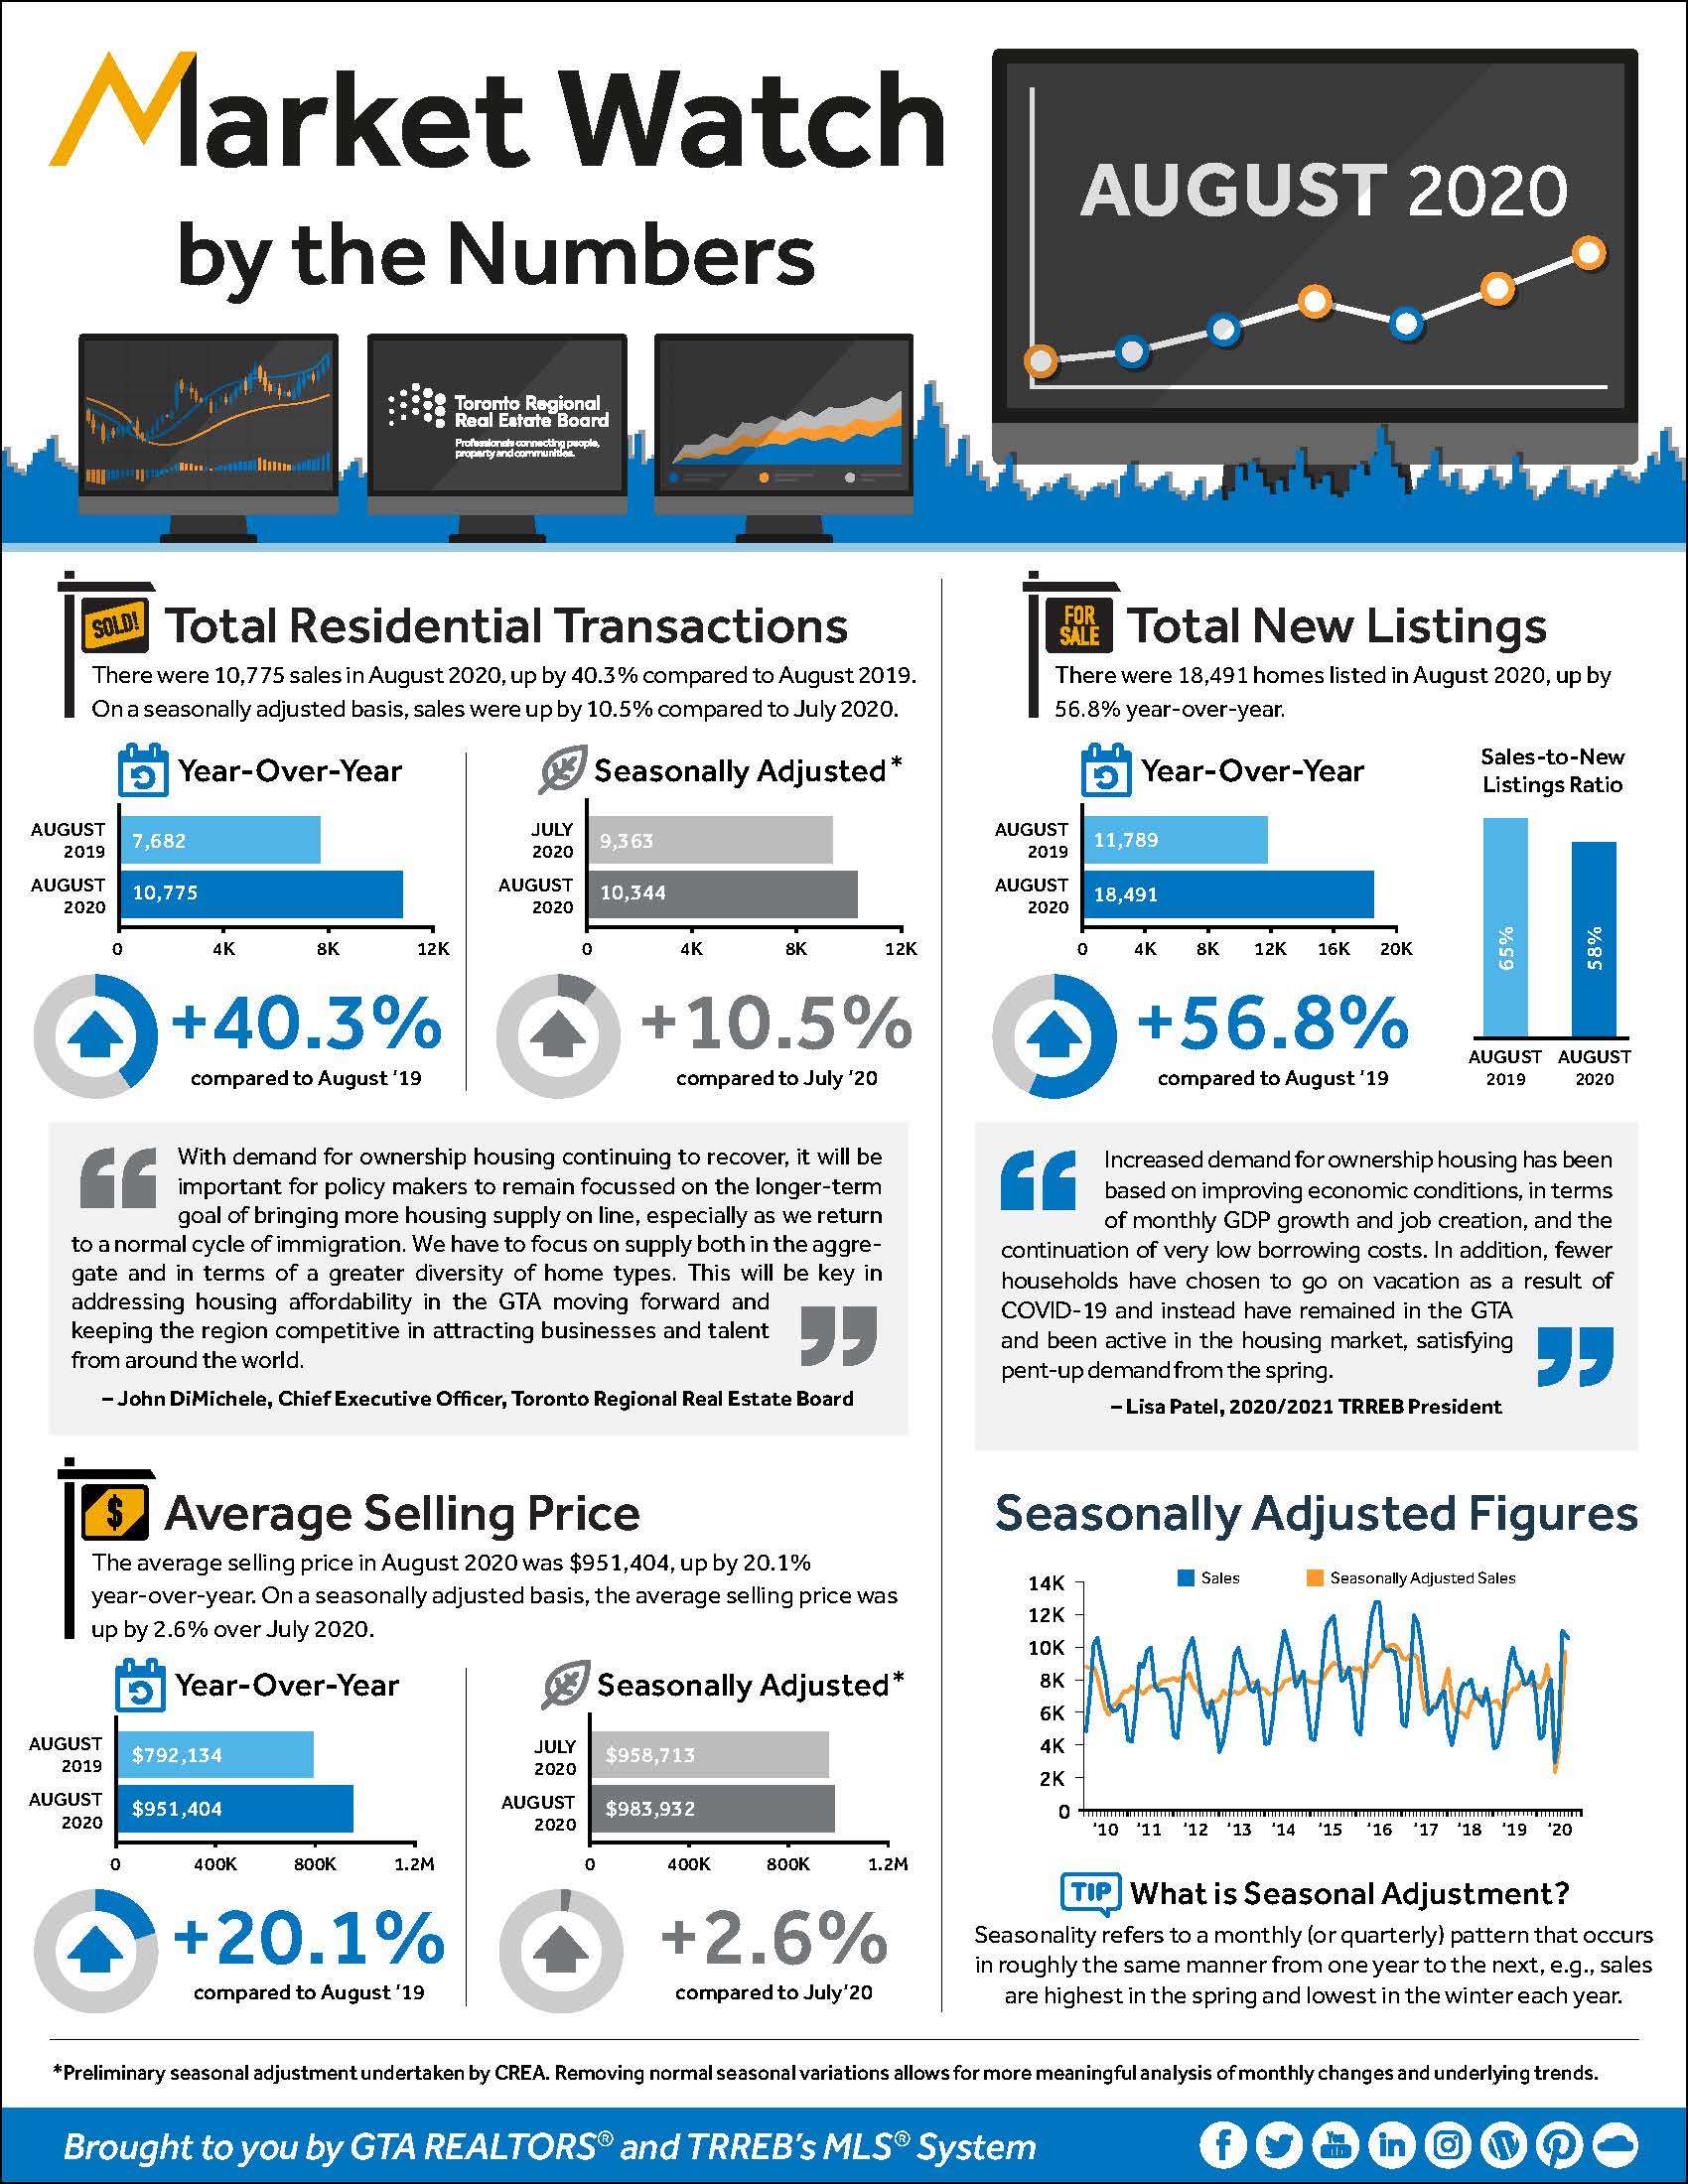
Staggering media-worthy numbers. BUT, seasonally adjusted tells the real story.
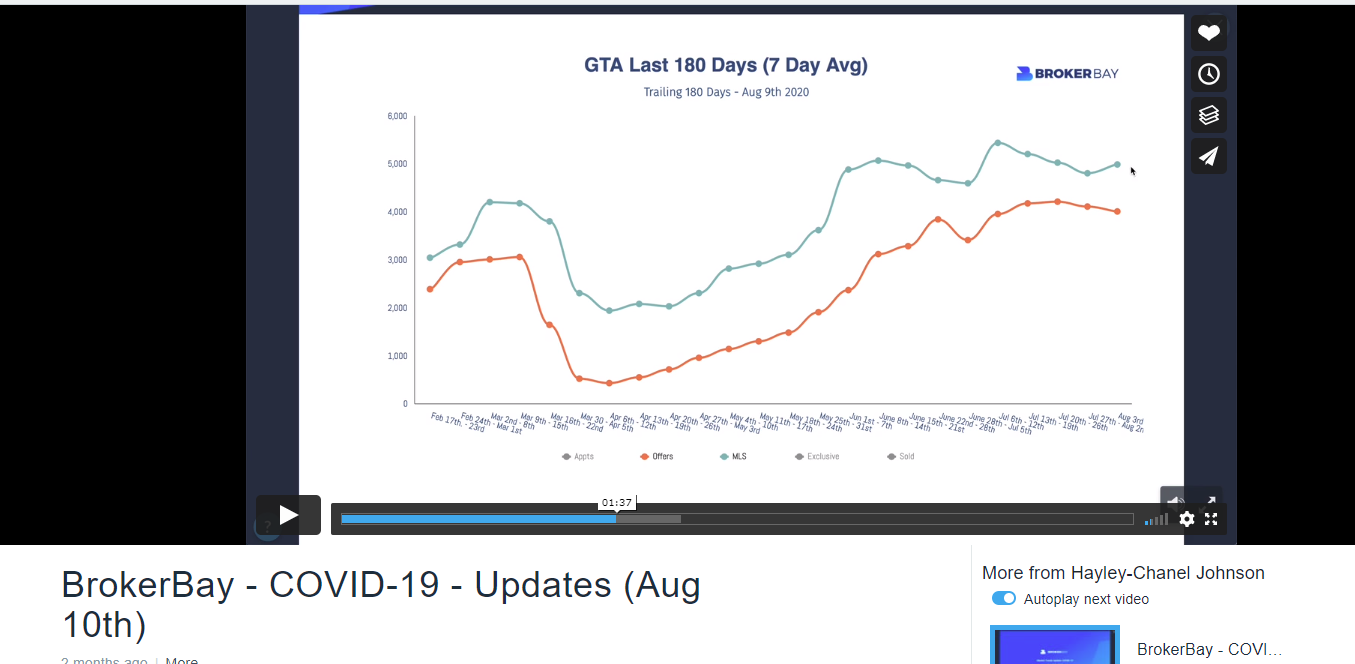
Number of Listings to Showings Diverge.
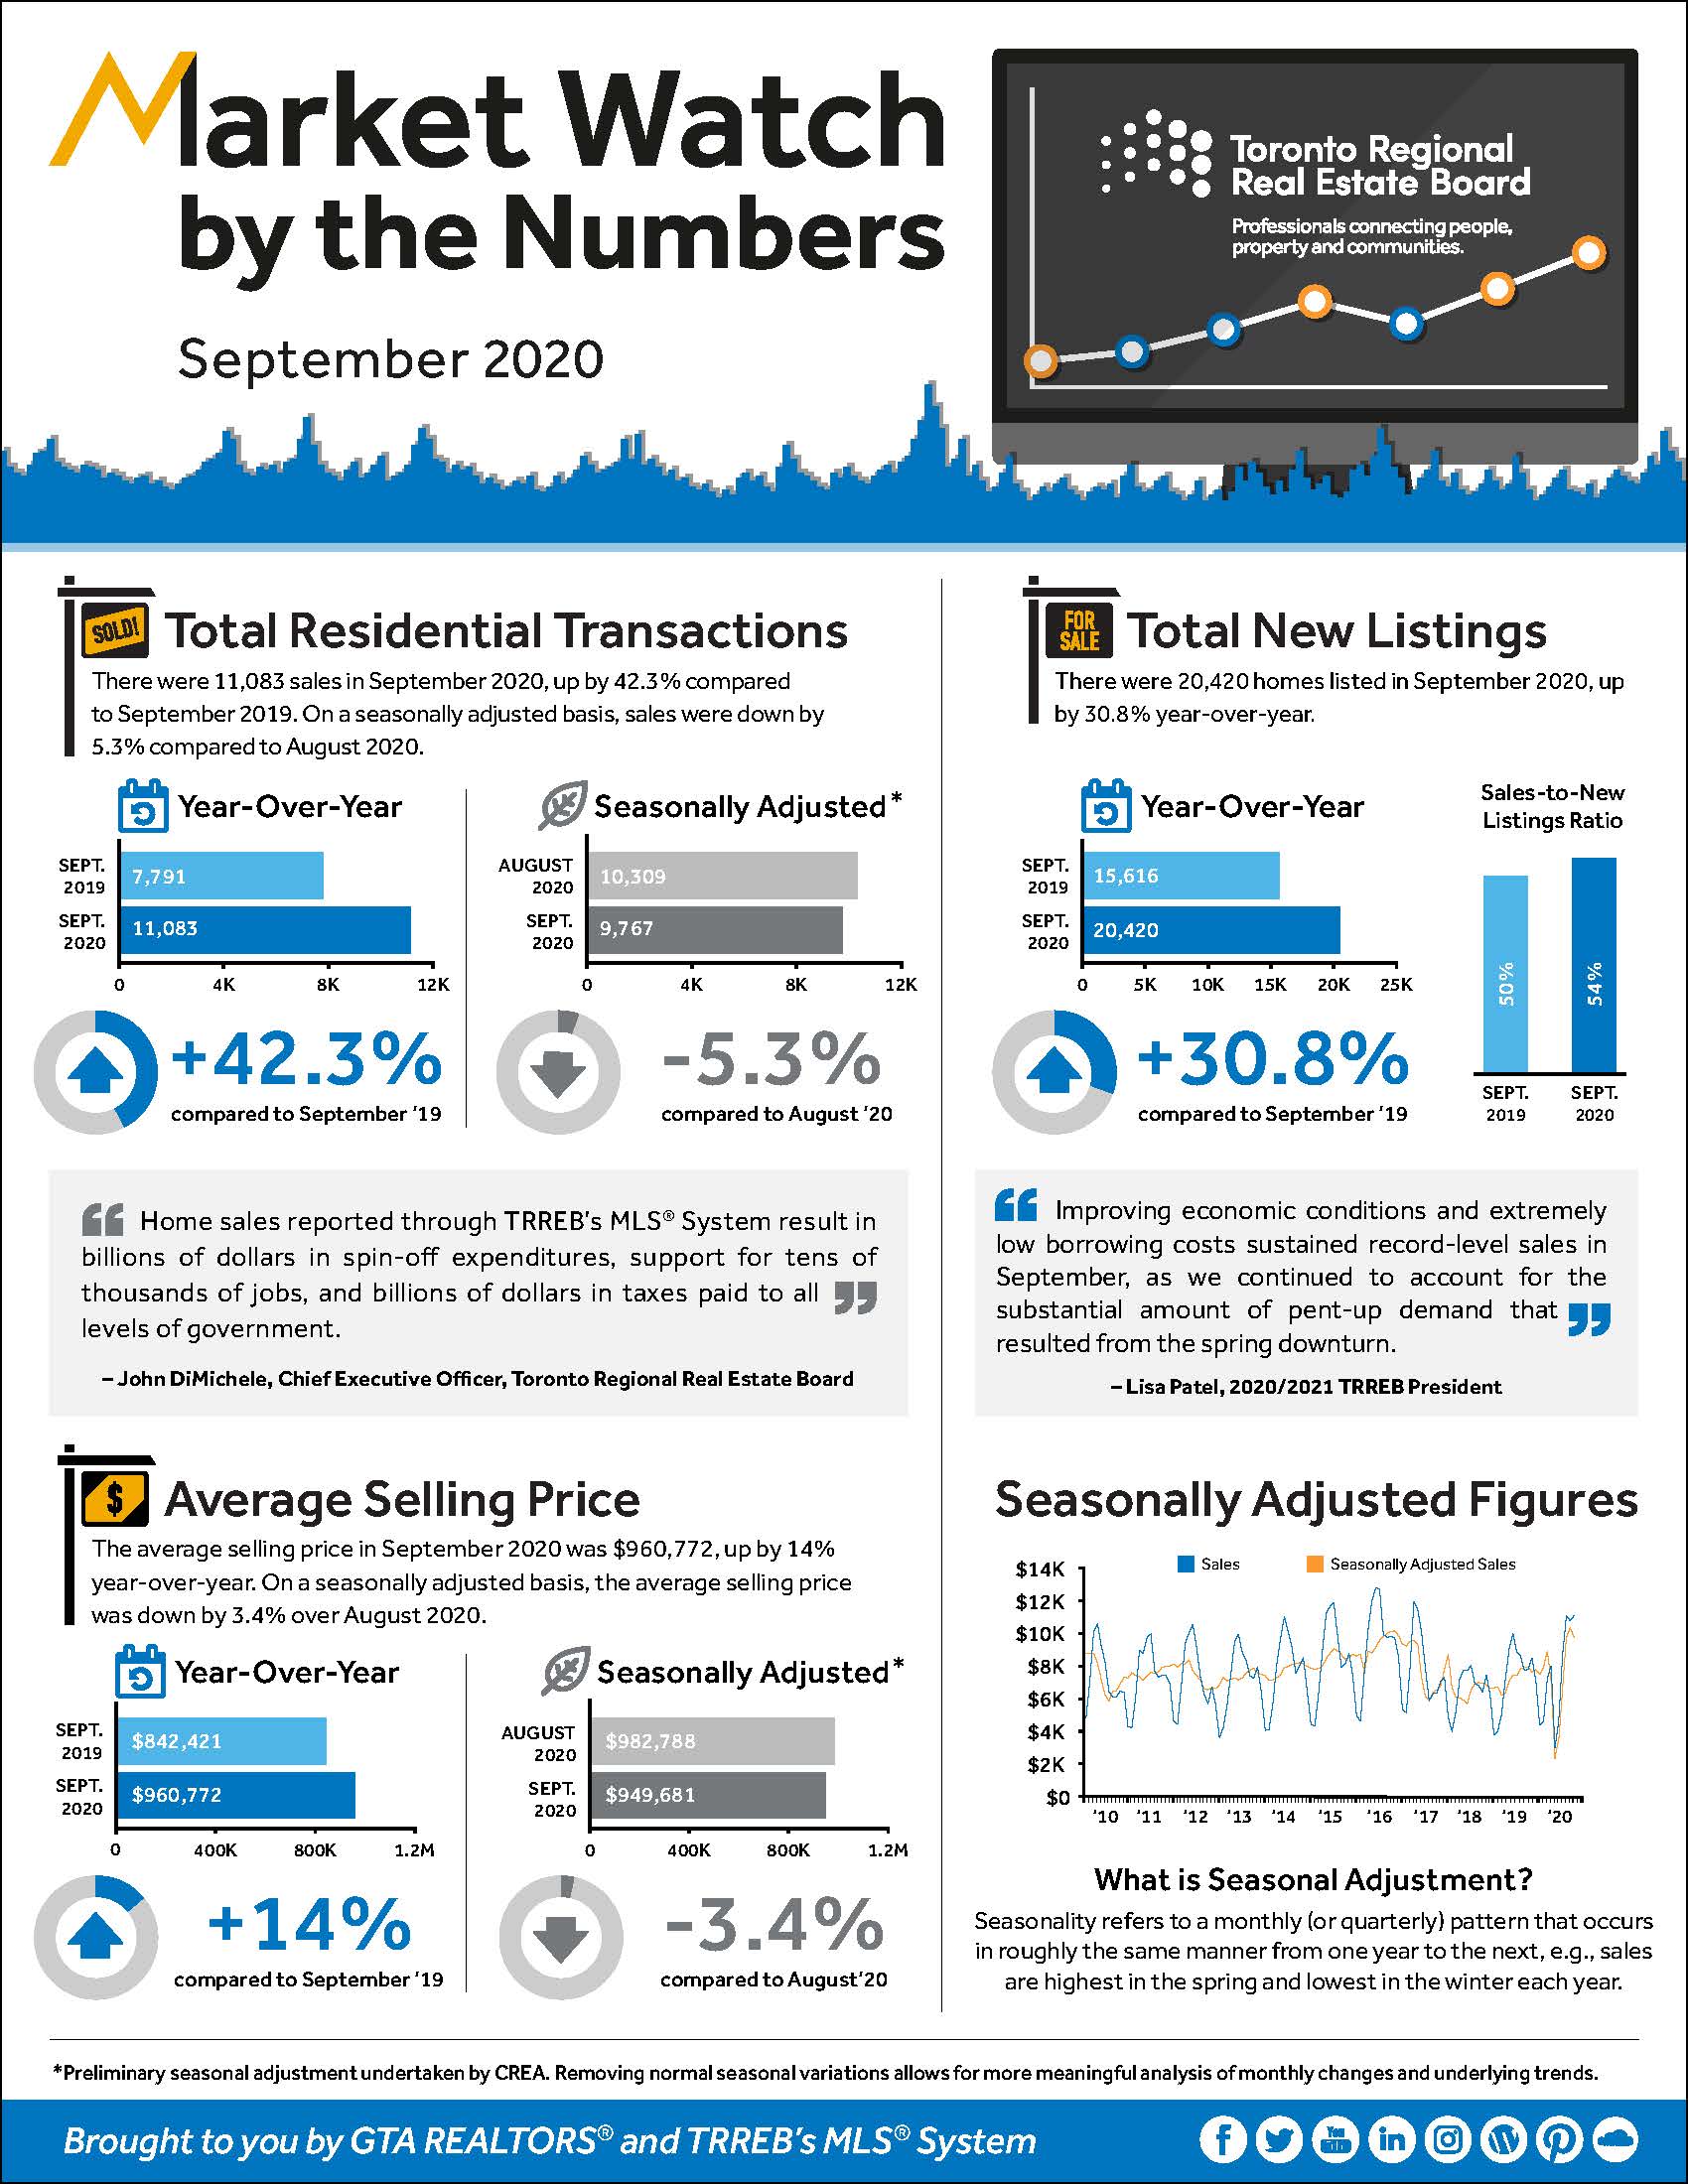
By September, the trend is apparent.