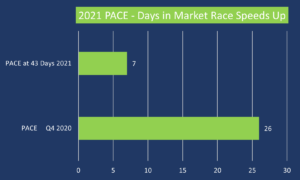
 It is a very intense market in these first 43 days of 2021. Particularly in the detached home market. It feels like prices are continuing to climb (based on list prices), and it feels like supply is not bountiful enough to keep up with demand. These feelings have merit but I don’t have enough data yet to give you figures. And I am the first one to say – we have to get the information right and not pander to drama through misrepresentation of the situation.
We receive the excellent statistical analysis done by the Toronto Real Estate Board. However, it lags the market activity. Quarterly reports have only just come out for Q4 2020. So interpreting the trajectory of the market in real-time becomes imperative. But that is what I do.
I can tell you that virtually every detached house being listed right now shares these things in common:
- There is an “offer date” set immediately and it is often less than 6 days after the listing date. That initiates the fast pace of the market.
- Showings are only allowed 30 minutes each, and every time slot gets filled. That makes demand appear very high.
- On the offer date, multiple offers are put forward, and it is near impossible to get an offer accepted that has the standard (appropriate) conditions for the Buyer of a property inspection and financing.
So this market is running totally in the favour of the Seller. It feels more intense than a similar recent period (Spring 2017). So similarly, it will fall off suddenly, just as it did in 2017 but for different reasons. Not the least of which Buyers start stepping away from this level of intensity – no time to properly consider your purchase, and unreasonable terms of multiple offers (at this level of intensity).
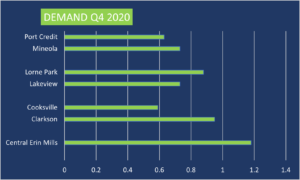
My analysis of the data from these 43 days suggests that Demand has softened – or at least the variables that measure demand have changed. The Buyers are still there – demanding – but the Supply (people listing their properties) has increased a bit over Q4 2020. The Demand metric is measure by the number of new listings that sell in a period. So technically demand is lower, so let’s look at why.
 Q4 2020 statistics are now available. The corridor of communities I studying had what was for me (12 years in the business) historically dramatic figures. Demand was well above 60%, the understood indicator of a Seller’s Market where demand outstrips supply. Clarkson in Q4 recorded 95% and Central Erin Mills was recorded at 118%. In the other communities, you can see all but one breached the 60% mark. So it is a wildly unbalanced market.
My interpretive analysis of the first 43 days of 2021 suggests more houses are getting listed, and the pace of new listings coming into the market is accelerating as I write this article. This affects the measured Demand figure and so it is down (in the first 43 days) from Q4 – but since that was crazy town levels, we can’t say Demand is “down” it is just lower relative to the data from late 2020.
This means that for all intents and purposes, what is listed to sell right now sells almost immediately. That translates to what we call “low inventory” and now we are in the supply/demand vortex that often pushes prices up to unreasonable levels for any given house. Therein lies some of the danger – that the house does not appraise for what the Buyer just agreed to pay.
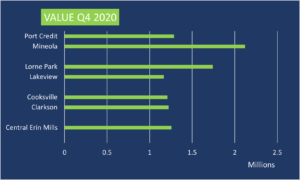
 We can’t say right now where the median sale prices will fall. But this is where it landed for Q4 2020 in the communities I studied, for detached houses. So time will tell if my predictions of a sudden diffusing will prevail. Right now the mortgage profile (low rates) and Buyer’s appetite for living in bigger space (COVID fatigue) are fueling the detached home market in the Golden Horseshoe and beyond.
